By: Steve Bilow, Sr. Product Marketing Manager
Recently we have focused on the analysis and diagnostics of IP media networks because we published a superb technical paper on that subject. It’s been a while since we’ve discussed other applications so, for the sake of application breadth, let’s turn back and journey further along the path of audio monitoring which we began several months ago. Today we will dive deeper into audio analysis using the surround sound display in the PRISM waveform monitor family.
Why is There a Surround Sound Display in the PRISM Waveform Monitor Audio App?
The greater the number of audio channels in a program the more difficult it is to manage and diagnose issues. That’s why we have optionally included a unique surround sound characterization tool in the PRISM Waveform Monitor. With it, you have an intuitive visual display to characterize your multi-channel image.
The surround sound display sits on the left side of the audio bars in the audio app. This is the same location when you would generally see the Lissajous display. In a surround environment with 5.1 or more audio channels, this display will provide tremendous insight into the characteristics of your aural environment.

Expanding on the Prior Discussion
As we discussed previously, the surround display (option SRND) can identify center channel and LFE correlation problems, find and isolate phase issues, help to balance downmixes and simplify balancing the stereo image width between any 2 adjacent channels (including front/rear pairs).
Our earlier post included a video that focused primarily on the “Total Volume”, “Dominance”, and “Center Channel” indicators in the middle of the display. It briefly described several other capabilities and now it’s time to explore them further. Because we focused on the Total Volume, center channel, and dominance crosshairs last time, in this post we’ll skip those and look at a couple of other components that run around the periphery of the display: the phase and phantom source bars.
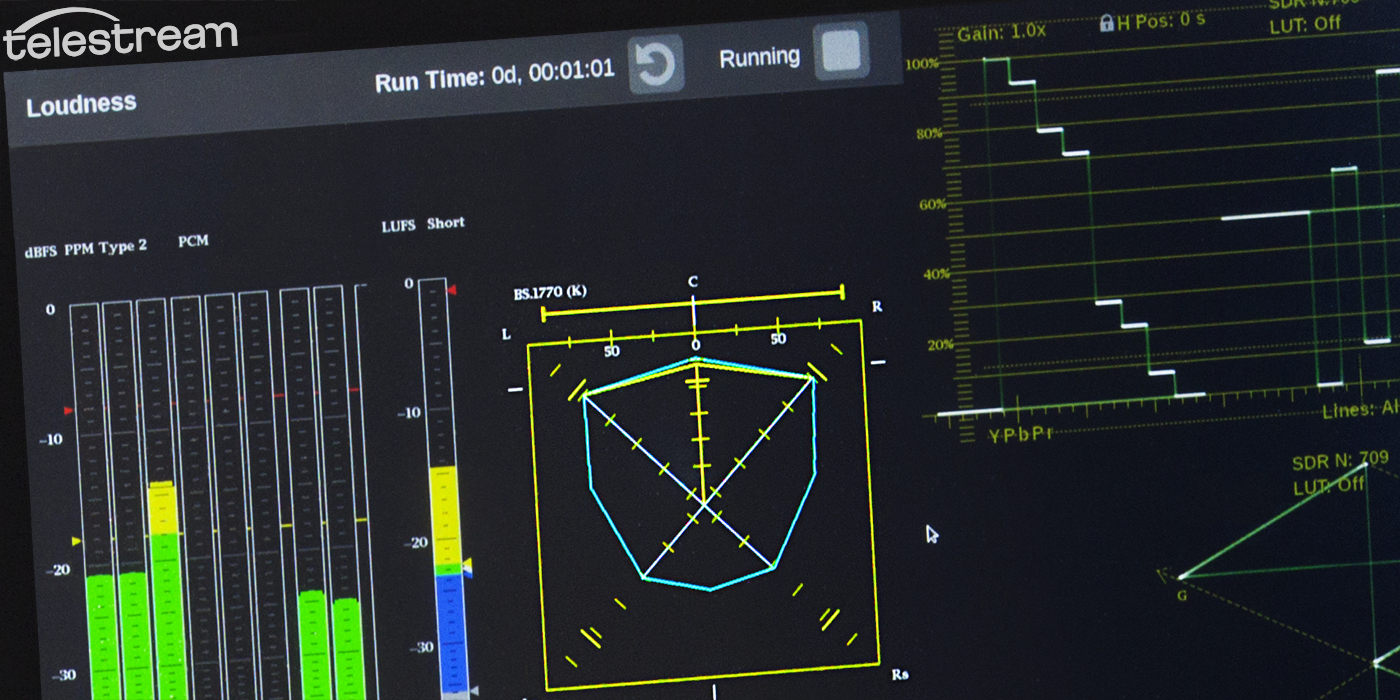
Before moving on to those, here is a quick review of the entire surround display. The individual indicators are below.

Monitoring Phase using the Surround Display in the PRISM Waveform Monitor
The Surround Display can show main phase relationships between adjacent channels in a surround image. Phase correlation between left and right rear (surround) channels is particularly critical because, when they are out of phase then, the surround image will sound “blurry” and the position of sounds within the space will be indistinct.
We will examine a few examples in a moment. For now, here’s a reminder of the functions these indicators perform.

The surround display includes 2 sets of lines that run between the channel indicators. they serve as phase correlation meters. These lines compare the signals in the two adjacent channels and show the correlation between them. Green means “correlated”, yellow is “uncorrelated”, and red is “out of phase”. The movement from green to yellow on the correlation displays surrounding the tool corresponds to the “inward” and “outward” movement of the four sides of the “box”.
For example, if we place equal frequency tones into each channel so that correlation is identical (i.e. r= +1), all sides of the Total Volume Display will “bulge”. (Out = Correlated). if we created completely uncorrelated inputs to these channels by feeding each an incoherent noise signal instead of a sine wave (so that r = 0), the lines would be completely straight. (Straight = Uncorellated.)

By changing the frequency of tone sent to the Rs channel by a few Hz that channel is no longer completely correlated with the front right channel and the connecting line segments bend inward. (In = switched polarity)

You will also see that because the 2 channels are only slightly different in frequency the tone will “beat” and the channels will go in and out of phase. In the diagram above the right phase correlation display has turned red because, at the moment the screen was captured, the 2 signals were out of phase.
Here is another example of a highly correlated set of channels. You can see this from both the convex nature of the Total Volume Display and the color of the Phase Correlation bars. Notice, also, that I’ve further lowered the amplitude of the rear channels (Ls and Rs) so that the surround image has both become very narrow and has moved toward the front of the space.

Finally, by creating phase anomalies among all the channels we can see that every channel is now out of phase with its nearest neighbor (except the front L and R channels). A front stereo image, possibly with dialog, is depicted here; the rest of the environment will be muddy and indistinct.

Admittedly, all of the examples above were simulated with test signals. The question remains: “How can all of this be applied with real live audio sources?” If you have ever diagnosed a surround system with an SPL meter and your ears, it’s probably clear. This type of tool can help identify phase issues resulting from wiring, timing errors, and many other causes. It can let you see – visually – when there is dialog from your center channel and, more importantly, find and correct low center channel presence issues. It can assist in balancing relative channel volumes to tune the width, size, and shape of a sound field. And it can give you many insights that you would not easily have without it.
Phantom Source Bars in the PRISM Surround Display
Finally, let’s have a look at the Phantom Source Indicators. The Phantom Source Indicators provide a visual representation of the center and width of each stereo image. From these simple colored lines, you can see the perceived position of the sound for a listener (a moving white dot), the width or spread of the image (the length of the bar), and phase correlation (where Good=Green, Unrelated=Yellow, and Swapped Polarity=Red).

These indicators are very similar to the phase correlation bars in that they help you to understand the relationships between each of the channels in a surround environment. The main difference is that they make it easy to identify the location of a sound in a stereo plane from the perspective of the listener.
More Information
The surround sound display in the PRISM Waveform Monitor was created in partnership with RTW GmbH. Additional information about their tools is available on their blog. Check it out here.
For more information on the PRISM family of software-defined Waveform Monitors visit our website here.